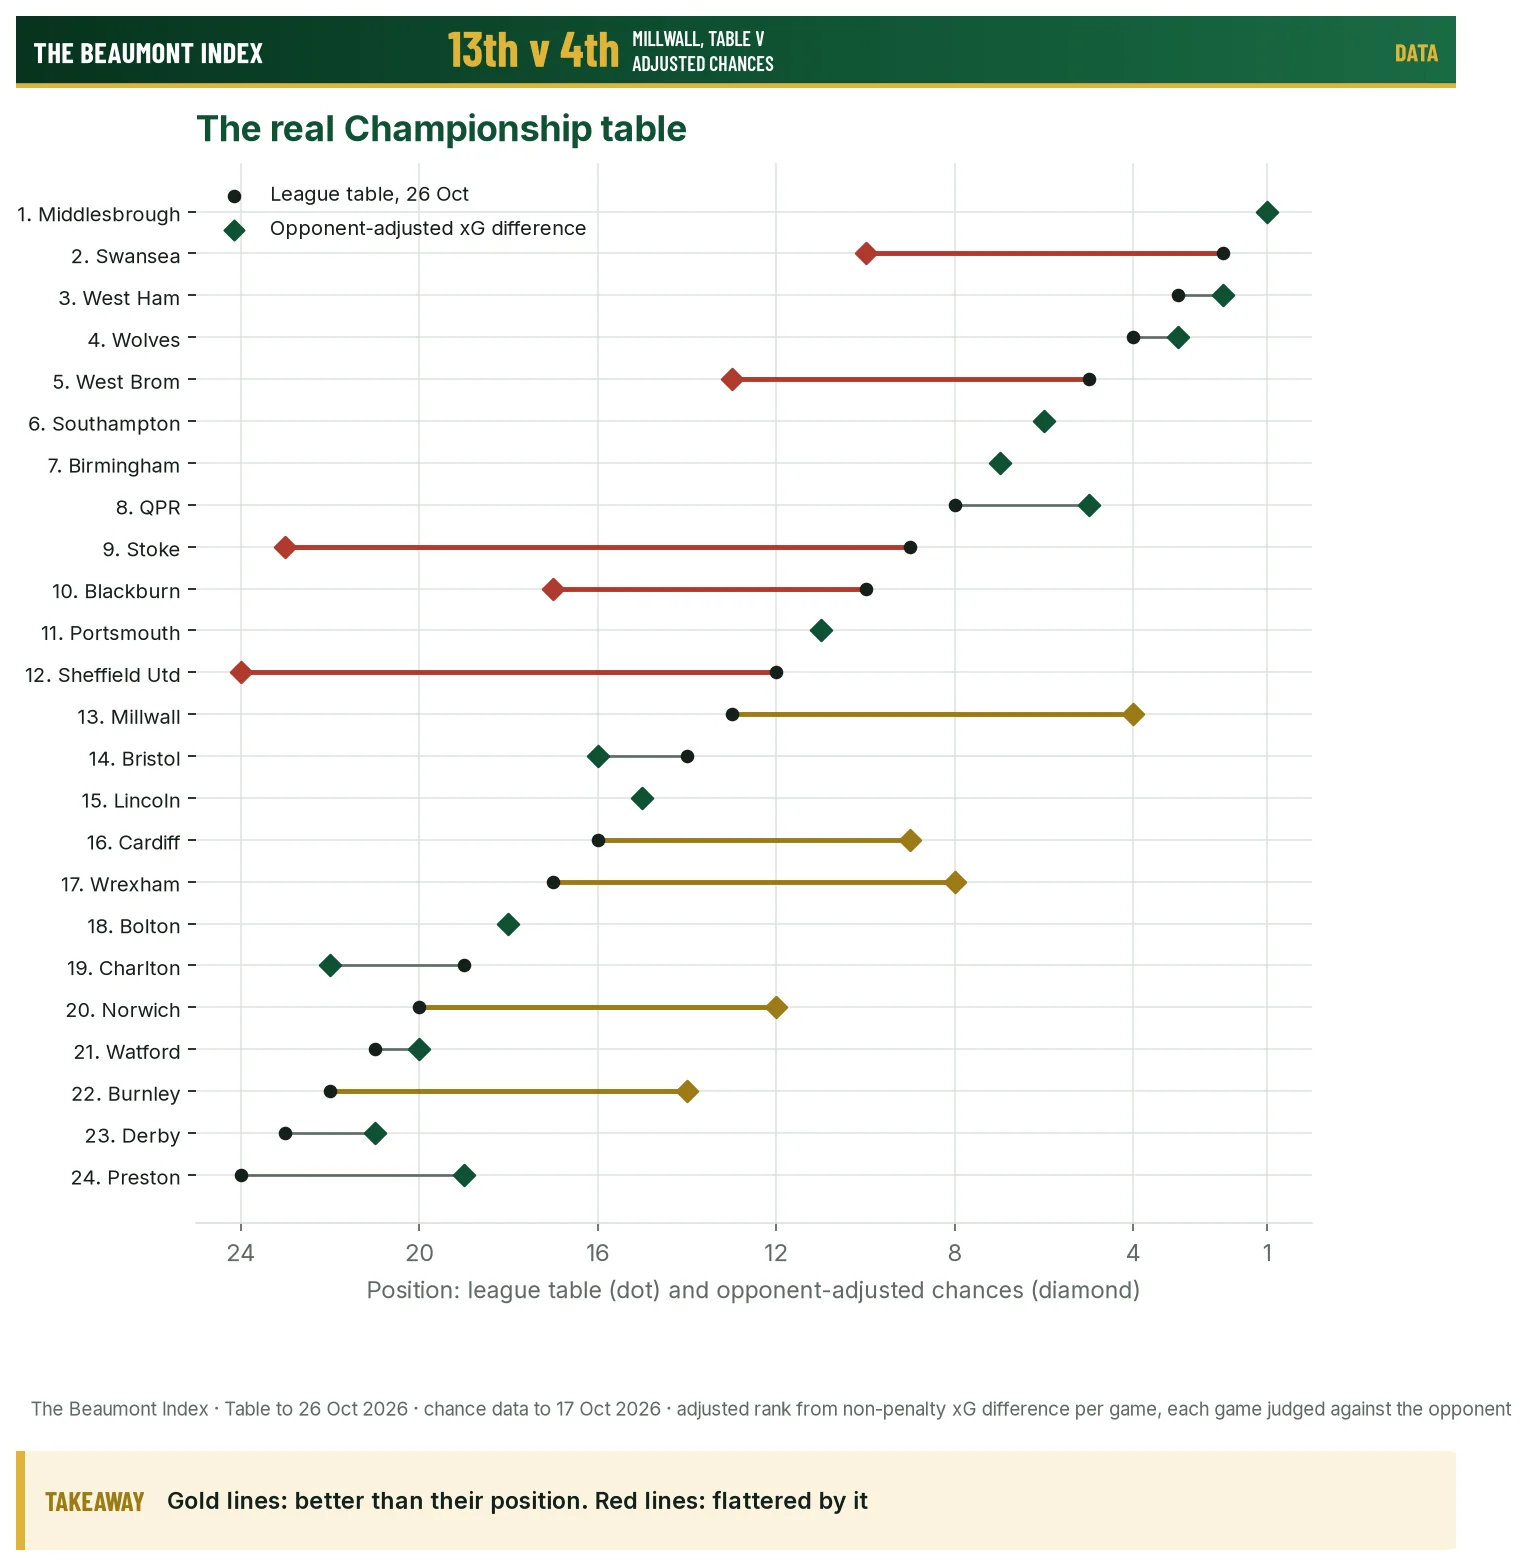
The short answerOn opponent-adjusted chances, Millwall are the Championship's fourth-best side, despite being 13th, after the hardest schedule in the league. Wrexham, Norwich, Burnley and Cardiff are also better than their position. Stoke (9th, 23rd on chances), Sheffield United, Swansea, West Brom and Blackburn are flattered.
Millwall are 13th in the Championship, and on the football they have played they are the fourth-best team in it. Once every game is judged against the quality of the opponent, their non-penalty expected goals difference is +0.63 a game, behind only Middlesbrough, West Ham and Wolves. They have also had the hardest set of fixtures in the division. At the other end, Stoke are ninth and Sheffield United 12th, but on chances they are 23rd and 24th. Both have finished almost a goal a game better than their chances.
The table and the football agree more often than not. Middlesbrough are top on both. Southampton are sixth on both, and would be second in the table without their four-point deduction. But across the 24 clubs, the average gap between league position and our adjusted ranking is 4.5 places. Ten clubs are seven or more places away from where their football says they should be.
How we built the real table
We start with non-penalty expected goals, for and against, in every league game this season. Raw numbers can mislead after 11 games, because the fixture list is still lopsided. Some clubs have already played most of the top six; others have barely met them.
So each game is judged against what that opponent normally does. If a side usually concedes 1.2 expected goals a game in its other matches and you created 2.0 against it, you get credit for the difference from the league average. The same goes in defence. The opponent's own game against you is left out, so a club is never measured against itself. The league average is 1.63 non-penalty expected goals per team per game.
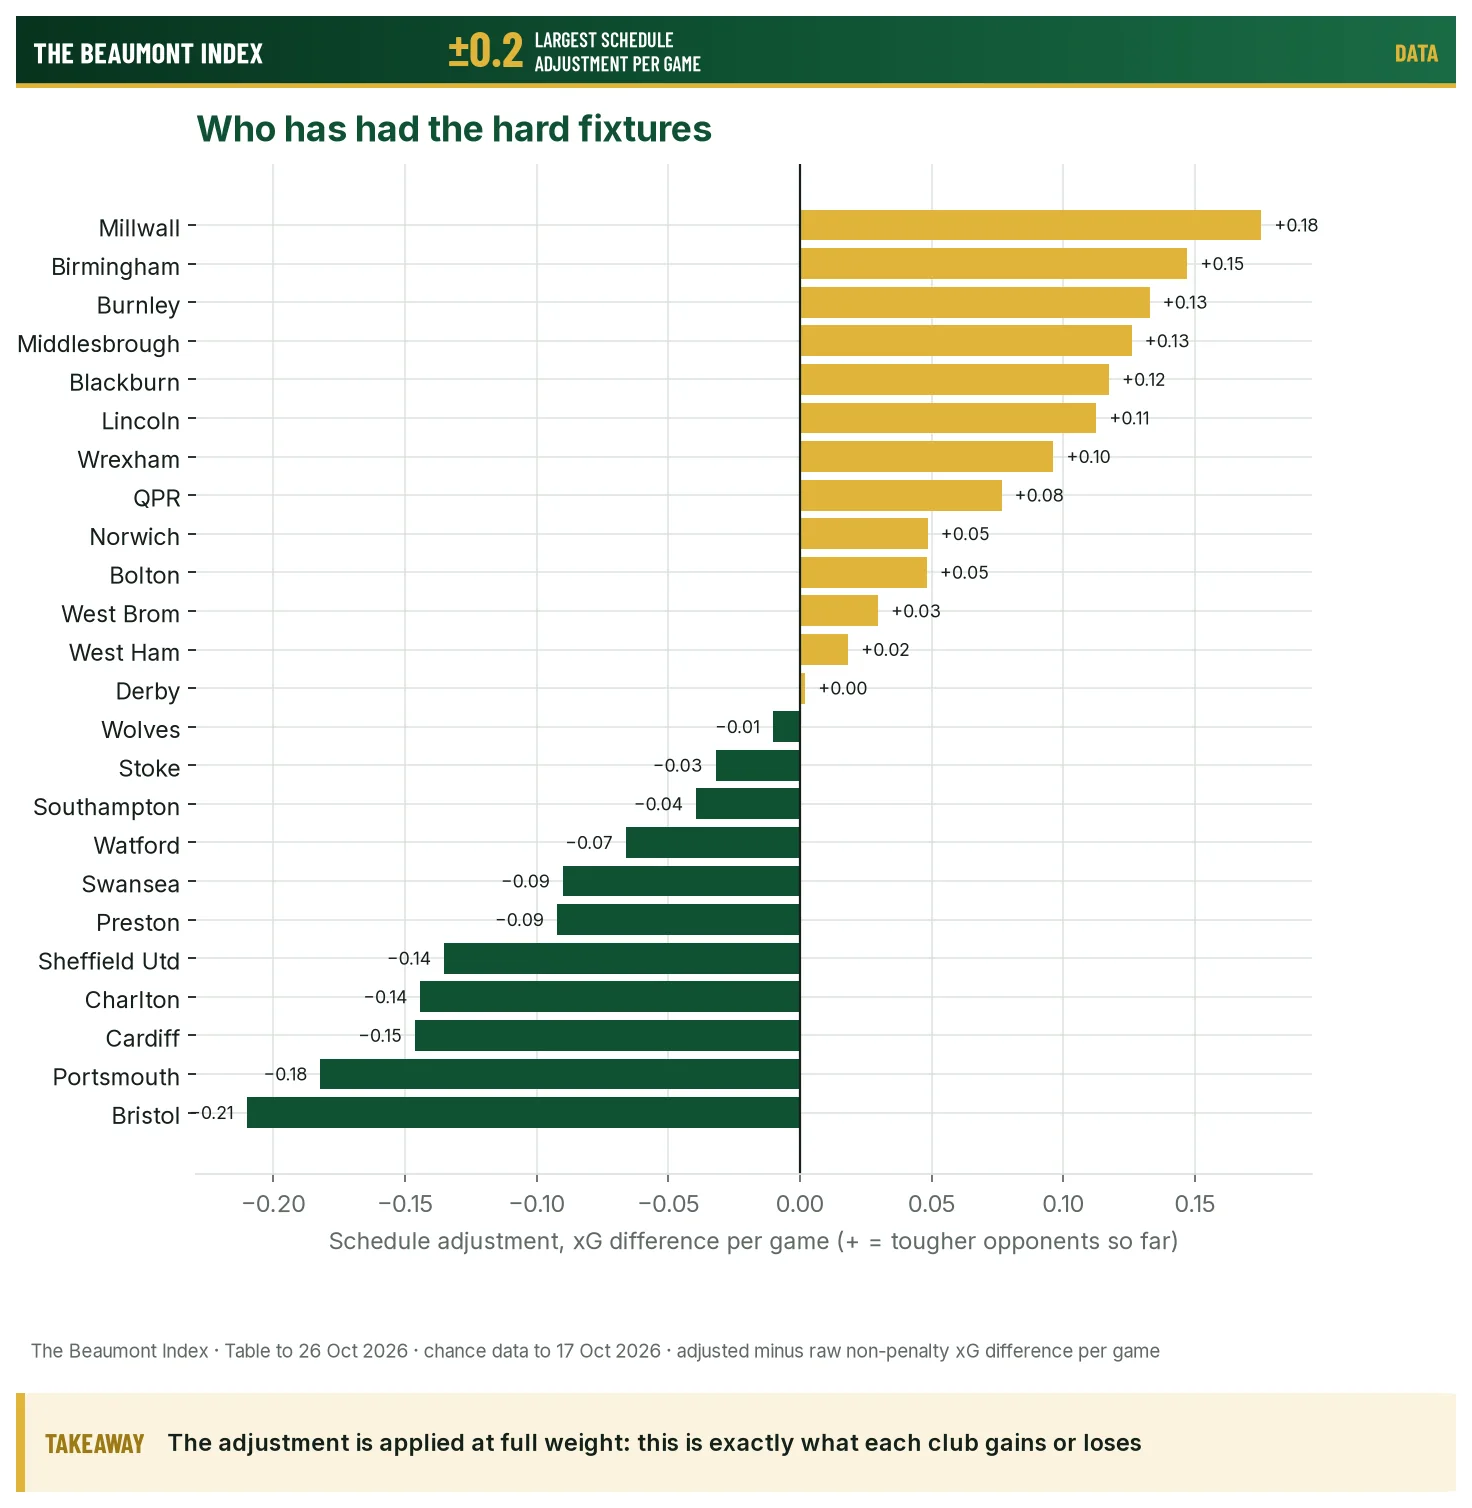
We publish the schedule adjustment in full. It is applied at full weight, so the figure in the second chart is exactly what each club gains or loses for its fixtures. The range is narrow, from −0.21 a game for Bristol City to +0.18 for Millwall. It's small next to the gaps between teams, but it is enough to move clubs several places. In the Beaumont Index itself, this season counts for only about 26% of a club's within-league score at this stage, so this table is a sharper read on current form than the Index ranking.
Better than their position
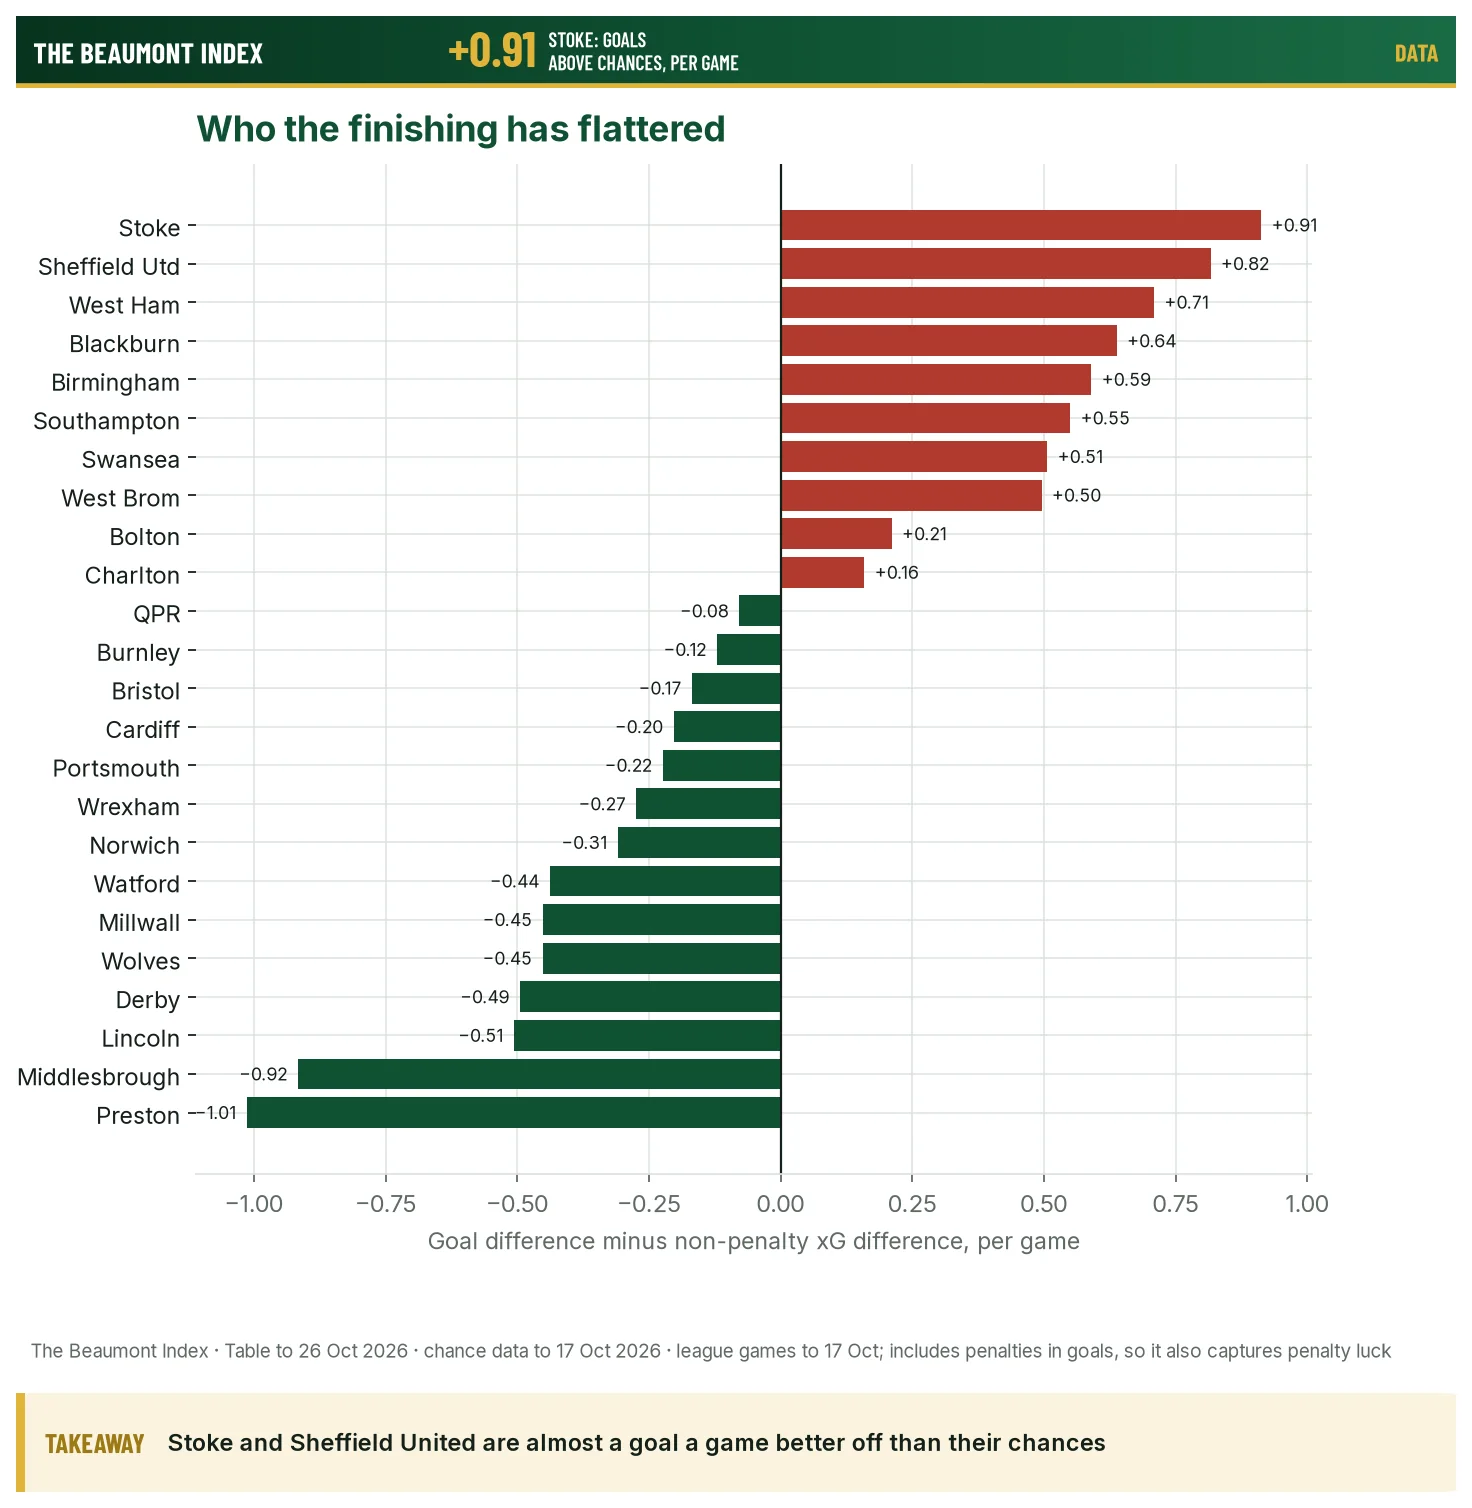
Millwall (13th in the table, 4th on chances). Their raw margin is +0.45 a game, 2.09 expected goals for and 1.63 against. Allowing for the hardest fixtures in the league adds another 0.18. The problem has been converting it. In the 11 games in our chance data they scored 18 and conceded 18, a level goal difference from football that was clearly better than their opponents'. That is about 0.45 of a goal a game below what the chances suggest. Of all the clubs in the bottom half, they are the one the numbers like most.
Wrexham (17th, 8th). A margin of +0.28 after a schedule that has been tougher than most, the 7th-hardest. Wrexham have conceded only 1.29 expected goals a game, the 3rd-lowest figure in the division, but have scored fewer than their chances. Five draws from 12 tell the same story.
It is applied at full weight, so the figure in the second chart is exactly what each club gains or loses for its fixtures.
Norwich (20th, 12th). Four wins and eight defeats, no draws, from football that is almost exactly level once opponents are counted (−0.01). Norwich are a mid-table side on the evidence, not a relegation one.
Burnley (22nd, 14th). One win all season, but the 3rd-hardest fixtures, and their adjusted margin of −0.20 is closer to mid-table than to the bottom three. They have been below average, not desperate.
Cardiff (16th, 9th). Cardiff create a lot, 2.33 expected goals a game, the 2nd-most in the league, and concede a lot, 2.03. Their schedule has been the 3rd-easiest, which takes 0.15 a game off their raw figure, and they still come out ninth.
Flattered by their position
Stoke (9th, 23rd). The biggest gap in the division, 14 places. Stoke have created 1.21 expected goals a game and allowed 1.94, a raw margin of −0.73. Yet in the games in our data they scored 18 and conceded 16. That is 0.91 of a goal a game better than their chances, the largest overperformance in the league. Their schedule has been close to average, so it isn't the fixtures. It is finishing at one end and goalkeeping or wayward shooting at the other, and neither tends to last.
Sheffield United (12th, 24th). Mid-table on points, bottom on chances. They have the lowest expected goals for in the division (1.10 a game) and concede 1.82. A relatively gentle schedule, the 5th-easiest, makes it slightly worse: their adjusted margin is −0.86. Their goal difference is positive; their football is not.
Swansea (2nd, 10th). Second in the table on 23 points, and the obvious name to watch. In the 11 games in our data Swansea conceded only 8 goals from chances worth 15.3. Their attack is about average. Their adjusted margin of +0.13 is that of a play-off contender, not an automatic promotion side.
West Brom (5th, 13th). 21 points from football that has been slightly below average once opponents are counted (−0.19). Like Swansea, West Brom have conceded fewer goals than their chances against suggest.
Blackburn (10th, 17th). Blackburn's raw margin is −0.55 a game; the 5th-hardest schedule softens that to −0.43, but they are still a bottom-half side on chances with top-half points.
Where the table is right
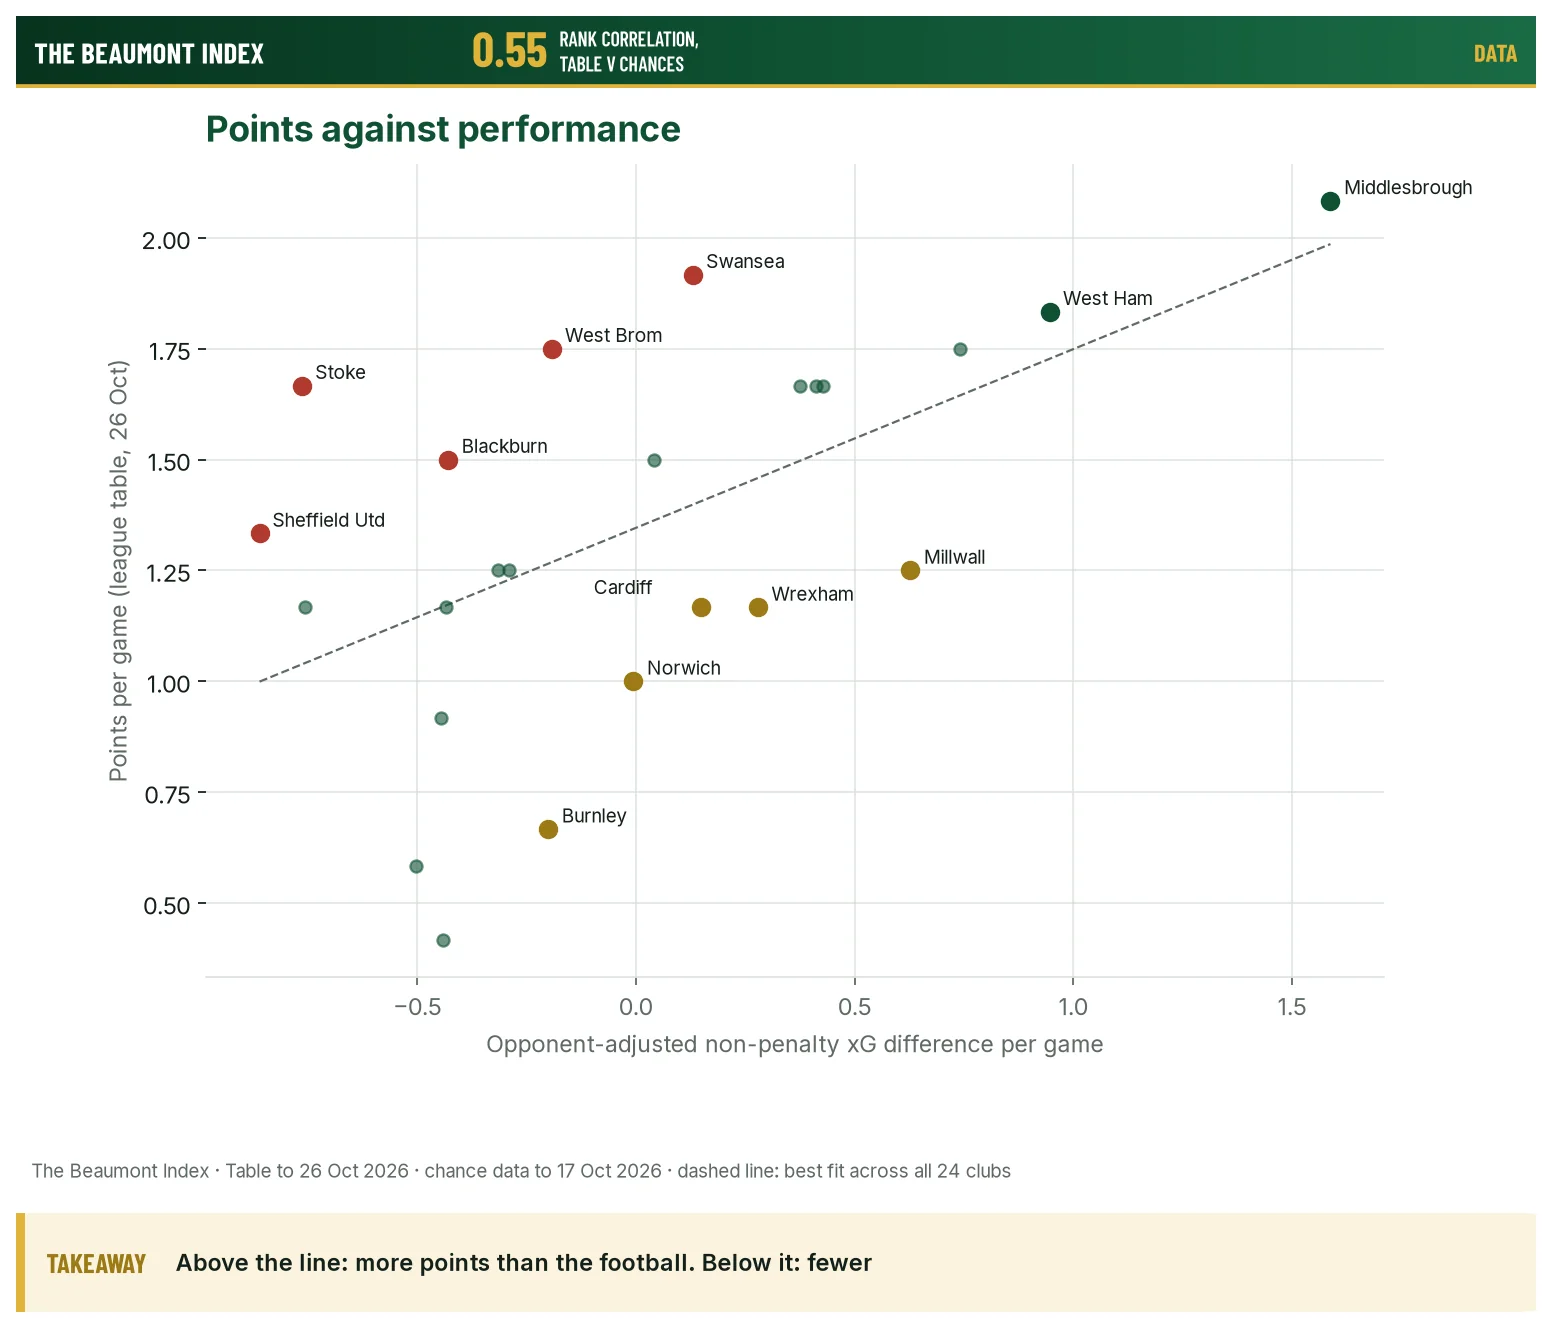
At the top, the table is broadly right. Middlesbrough's adjusted margin of +1.59 is the best in the division by a distance, and West Ham (+0.95) and Wolves (+0.74) are second and third on both measures, give or take a place. QPR, fifth on chances, are eighth in the table. Southampton are the interesting case. Their football is the sixth-best in the league and they are sixth, but only because of the deduction. On the points they have earned on the pitch, 24, they would be second.
At the bottom, Preston and Derby really are struggling, although Preston are unluckier than anyone. They have finished 1.01 of a goal a game worse than their chances, the biggest shortfall in the league, and are 19th on adjusted chances rather than 24th. Charlton (22nd on chances) and Watford (20th) are where their football says they should be: near the bottom.
Six clubs sit in exactly the same place on both measures: Middlesbrough, Southampton, Birmingham, Portsmouth, Lincoln and Bolton. Portsmouth's place is worth a note. They have conceded only 1.18 expected goals a game, the second-lowest in the league, but their schedule has been the second-easiest, which costs them 0.18 a game in the adjustment. That is the schedule effect at work: Portsmouth's raw margin would put them higher, and the fixtures pull them back to 11th. Two clubs, Portsmouth and Wolves, have played one game fewer than the rest in our chance data, so their figures rest on ten games.
What it means for the rest of the season
A gap between results and chances is not a forecast that it will close in a particular week. But over a season, chance difference is a better guide to where a team finishes than its goal difference after 12 games. The overall link between our adjusted table and points per game is real but loose: a rank correlation of 0.55. That's what you would expect at this stage, and it is why a 46-game league can still reshuffle so much.
If the pattern holds, Millwall have the clearest case for climbing, and Wrexham, Norwich and Cardiff should drift upwards. Stoke and Sheffield United need their finishing to stay well above normal to keep their places. Swansea have the points already, so their question is whether they can keep conceding so little from what they allow.
Our verdict
Millwall are the best team outside the top 12 by a distance; Stoke are the most flattered. Middlesbrough are rightly top. Swansea and West Brom are higher than their football, Millwall, Wrexham and Norwich lower. We will update this table as the season goes on.
FAQ
Which Championship team is better than its league position?
Millwall. They are 13th in the table but fourth on opponent-adjusted xG difference (+0.63 a game), after the hardest fixtures in the league. Wrexham, Norwich, Burnley and Cardiff are also seven or more places better than their position.
Which Championship team is most flattered by the table?
Stoke. They are ninth but 23rd on opponent-adjusted chances, and have scored or saved almost a goal a game more than their chances suggest. Sheffield United are 12th in the table and last on chances.
How do you adjust for strength of schedule?
Each game is compared with what that opponent creates and concedes in its other matches, against the league average. The adjustment is applied at full weight, and we publish it for every club; it ranges from about minus 0.2 to plus 0.2 expected goals a game.