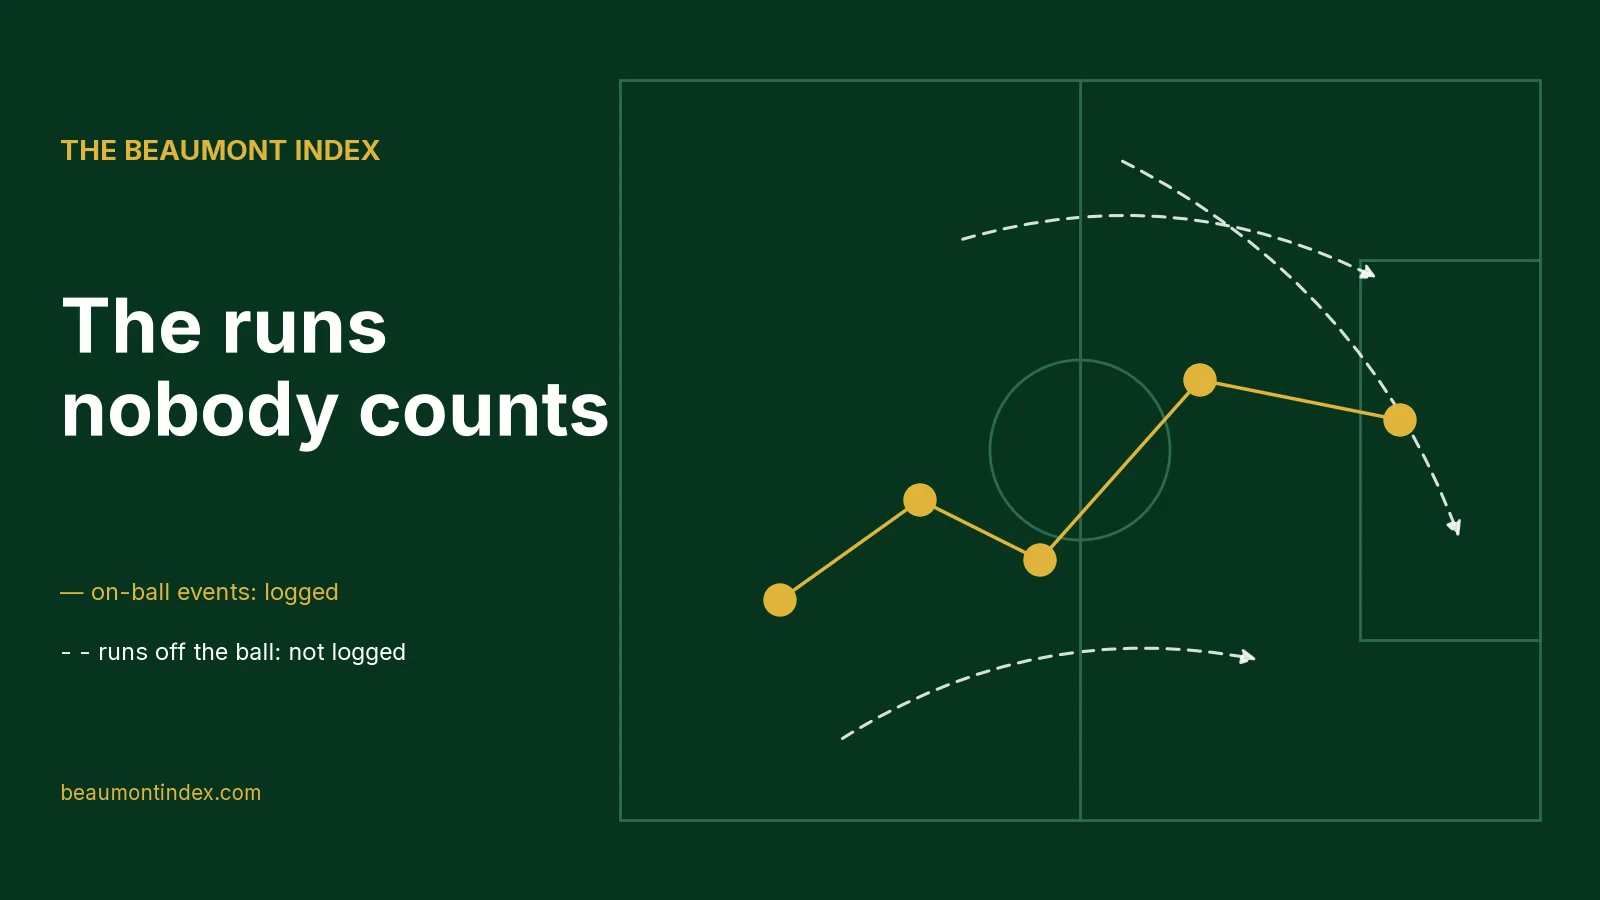
The short answerMost football data records events on the ball: passes, shots, tackles, carries. A run that drags a defender away, or a press that forces a hopeful clearance, often creates no event at all, so it earns nobody any credit. Our numbers have the same blind spot. We can see its effects in team totals, but we can't yet price the run itself.
Jude Bellingham did not score in the Clásico and did not register the assist for either goal. Our tactical analysis still argued that his night was won without the ball: a big tackle in the 33rd minute started the move that ended with Kylian Mbappé's overhead kick over the bar, and after half-time he was part of the block that held Barcelona to one goal.
Look at the numbers for that night and you will find the tackle, because a tackle is an event. What you won't find is most of the rest: where he stood so that passes never went his way, the ground he covered to get into that block, the space he closed before anyone tried to use it. When he wasn't touching the ball, the data barely knew he was there.
That is the problem with football data in one moment. It is very good at describing the ball. It is much worse at describing the 21 other people on the pitch.
What the numbers actually record
Almost every football statistic you have seen, ours included, is built from event data. Someone, or something, logs each time a player does something to the ball: a pass, a shot, a tackle, an interception, a dribble, a clearance. Each event has a time, a place, a player and an outcome.
That is a remarkable amount of information. It is how we know that Middlesbrough lead the Championship in shots (18.8 a game) and in positional attacks (33.9 a game, against an average of 26.9). It is how we can say that Ture Spendler is first of 63 Superettan full-backs for progressive passes.
But an event needs a ball. A centre-forward who runs across the near post to pull a centre-back with him, so that the winger has a free header at the far post, has done his job perfectly. In the event log he does not exist. The winger gets the shot. The crosser gets the chance created. The decoy gets nothing.
Even the busiest player has the ball for only a small part of a match. Event data describes those moments in great detail and the rest barely at all.
It is how we can say that Ture Spendler is first of 63 Superettan full-backs for progressive passes.
Bellingham, again
Our tactical analysis of the Clásico was headlined around one idea: Bellingham's night was won without the ball.
He didn't score. He didn't register the assist for either goal. On the ball his night was mixed: twice he had a chance to release Mbappé on a break and didn't find the pass. A box-score reading of his game would be a shrug.
Much of what made his night happened off the ball. A big tackle in the 33rd minute started a move that ended with Mbappé's overhead kick over the bar. After half-time, when Barcelona pushed, Bellingham was part of a block defending the Madrid box, not a spectator to it. That block held Barcelona, who had been scoring heavily all season, to one goal.
Even his best moment on the ball barely registers. Three minutes from time, his turn under pressure started the move for Mbappé's winner. The assist went to Eduardo Camavinga, who made the cutback. In the box score, Bellingham's part in the goal that decided the Clásico does not appear.
Some of that does show up. A tackle is an event. But "was in the right place so that the pass never went there" is not. The best defensive work often looks, in the data, like nothing happening.
Pressing: we can count the result, not the effort
Pressing is the clearest case of off-ball work that the numbers half-see.
We measure a team's pressing as the number of passes it allows its opponent before it makes a defensive action: a tackle, an interception, a foul, a challenge. Lower means more aggressive. When Barcelona went to Betis, they allowed 7.4 passes per defensive action. Betis allowed Barcelona 38.3. The LaLiga median this season is about 11.6.
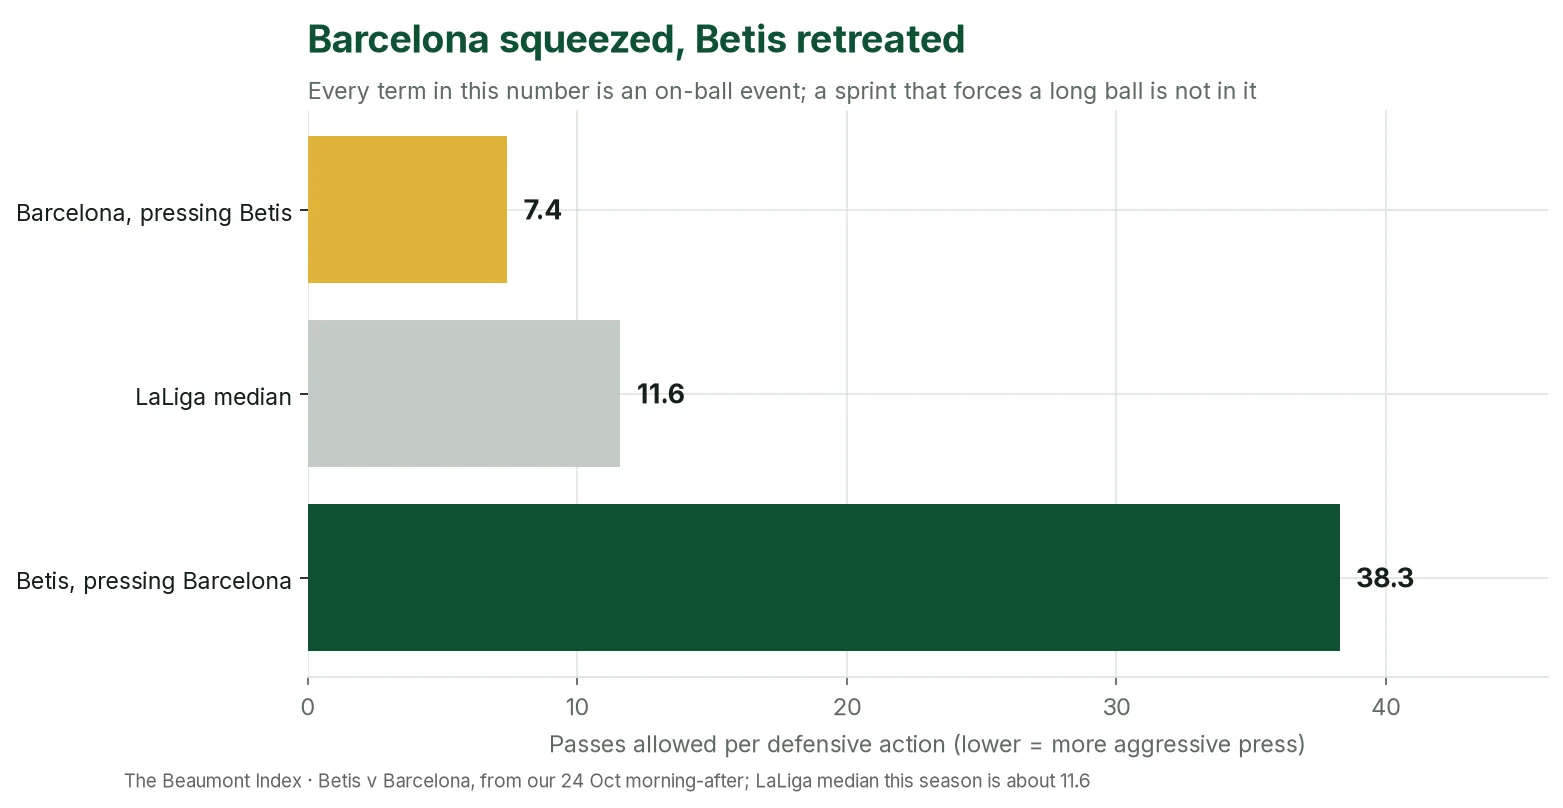
That number is useful. It told us, accurately, that Barcelona squeezed and Betis retreated. But look at what it is made of. Every term in it is an on-ball event. A forward who sprints 30 yards to close down a centre-back, forcing a long ball that goes out of play, has done exactly what his coach wanted. Unless he touches the ball, his sprint isn't in the number.
We said as much in that piece: these counts tell you who made a tackle, not where on the pitch it happened. We couldn't split the numbers by half either, so we couldn't say how much of the Betis retreat was choice and how much was the red card.
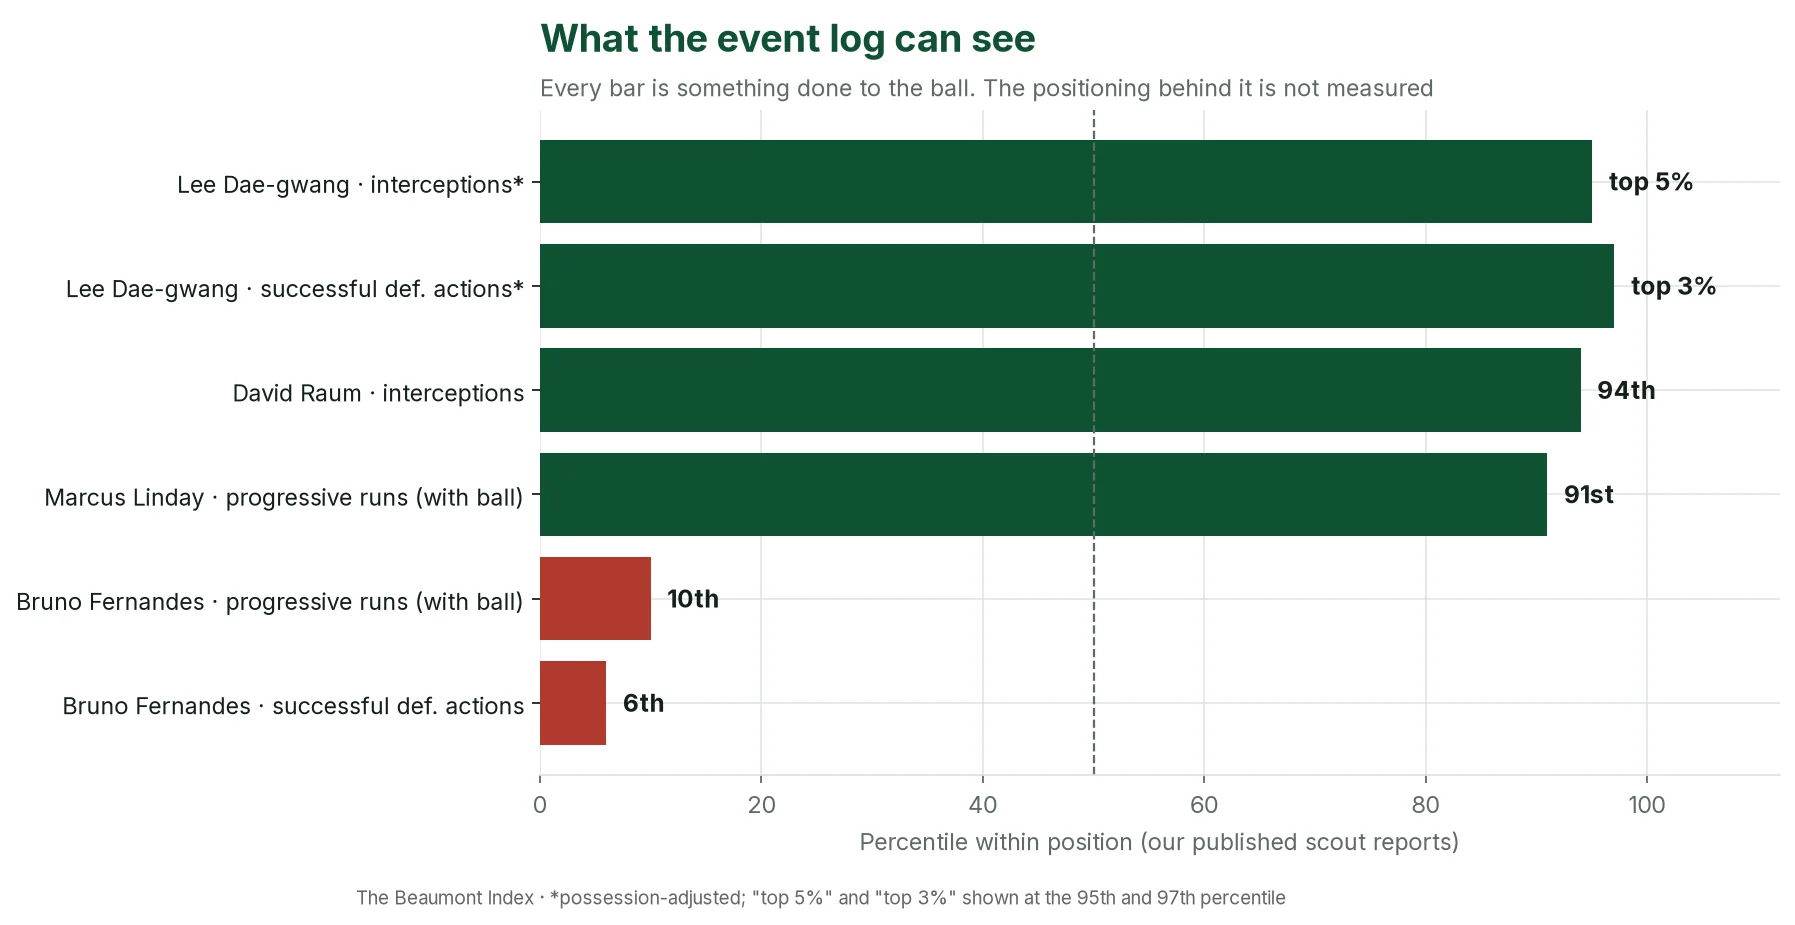
The same limit hits players. When we wrote about Bruno Fernandes, the warning sign was that his successful defensive actions had fallen to the 6th percentile of his position (2.72 per 90). That is a fair number to worry about. But it measures the tackles and interceptions he completes. It cannot see whether he is still running to close passing lanes, or doing it a second later than he used to. Two players with the same count can be pressing very differently.
"Progressive runs" are not runs
A small confession about our own vocabulary.
When our scout reports talk about a player's progressive runs, as they did for Fernandes (down to the 10th percentile, 0.39 per 90) or Marcus Linday (91st percentile), they mean running with the ball: carries that move it meaningfully towards goal. They don't mean a run without it.
The name is standard, and we have kept it. But it is a neat example of the problem. Even the word "run", in football data, has quietly been taken over by the ball.
Where off-ball work leaves fingerprints
None of this means off-ball work is invisible. It leaves marks, mostly in team numbers.
Middlesbrough are the best example we have published. On our style measures they have the most box presence in the Championship, close to three standard deviations above the league norm. They create the most expected goals per game (2.82), and their chances are better than average: 0.15 expected goals per shot, against 0.13 for the league.
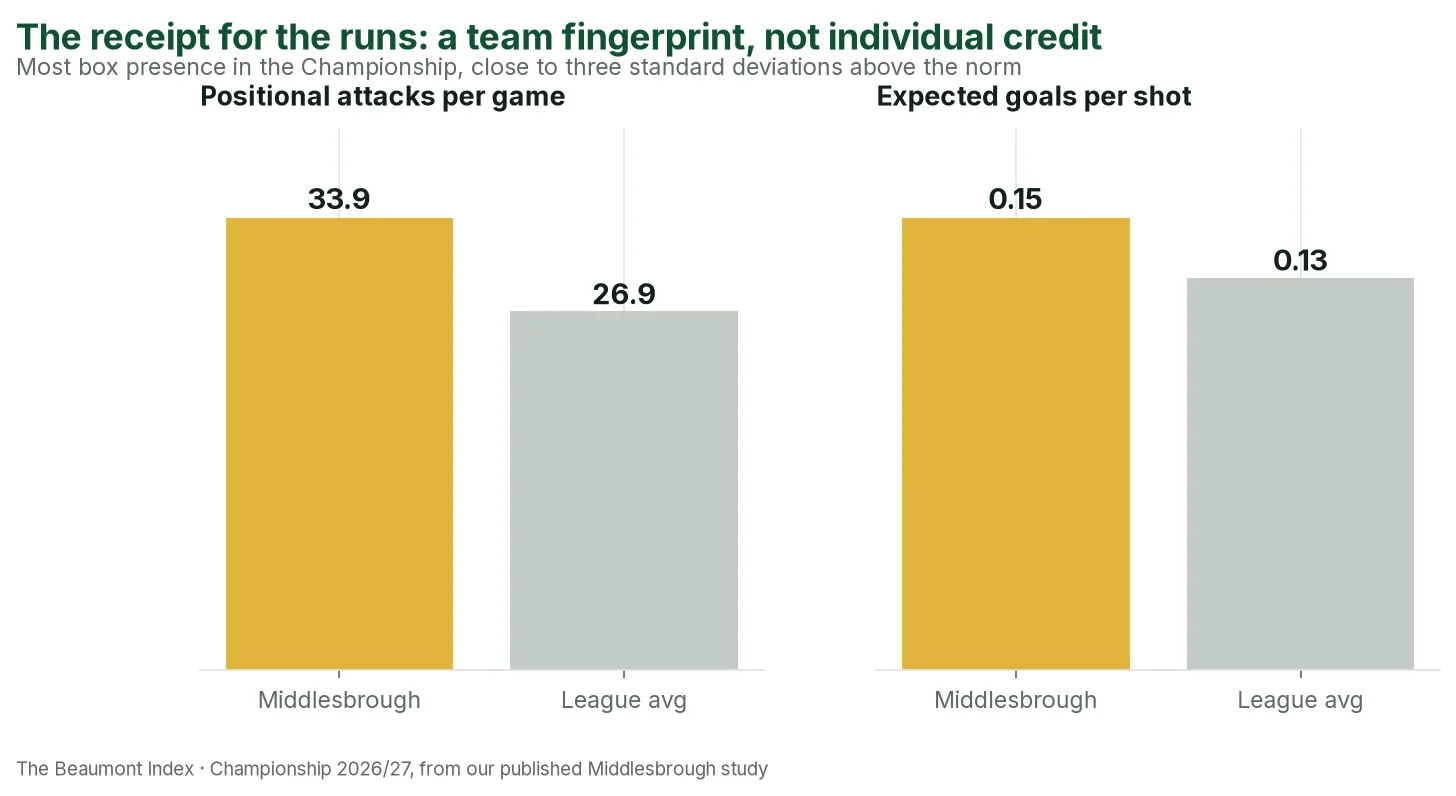
None of that happens without players making runs into the box. The attacking numbers are, in a sense, the receipt for all those runs. What we can't do is say whose runs they were. The box presence belongs to the team. The expected goals are assigned to whoever shot. The forward who made the run that freed the shooter adds to the total and gets none of the credit.
Defence works the same way. We have adjusted interceptions for how much of the ball a team has, because a side that is always defending gets more chances to intercept. That adjustment is why we could say that Lee Dae-gwang, a K League 2 striker, was in the top 5% for interceptions and the top 3% for successful defensive actions in early October. That suggests a forward who works hard without the ball. It is still an inference from the moments he wins it. A striker whose positioning means the pass is never attempted makes no interception at all.
When David Raum was in the 94th percentile for interceptions among Bundesliga full-backs last season, we wrote that he reads the game well. That is a reasonable reading, but it is a reading. Interceptions are the visible tip of good positioning. Plenty of good positioning never produces one.
The step-up blind spot
This matters most for the thing we care about most: saying which players can step up a level.
When we wrote about Spendler, the key evidence was that full-backs moving from the Superettan to the Allsvenskan kept a median 94% of their progressive passing. We can test that because passing is an event. We have the before and the after.
We can't run the same test on off-ball work, because we don't have it in the first place. If a full-back's real strength is recovery runs, or holding the line at the right moment, our step-up evidence will undersell him. If his weakness is drifting out of position when the ball is on the other side, our numbers may oversell him. Spendler's defensive actions rose from the 24th percentile to the 95th over three seasons. That is a real improvement in what he does when he engages. It is not, on its own, proof that his positioning has improved.
That is one reason every scout report we publish leans on watching the player as well as the numbers, and why we say when a verdict rests mostly on the ball.
How you would actually measure it
The honest answer is that you need to know where everyone is, all the time, not just where the ball is.
With that kind of positional data, you can start to ask the right questions. Which runs pulled a defender out of shape? Which run opened the lane that the pass went through? Which presser cut off the easy pass and forced the long one? You can then compare the chances a team had with the run against the chances it would probably have had without it. That gives the run a value even when the runner never touches the ball.
Work like that exists. It isn't yet in the numbers most of the public sees, and it isn't in ours. Our ratings, our chance models and our scout-report percentiles are built from what happens to the ball, and adjusted, carefully, for opponents and league strength.
What we promise
Three things.
First, when a verdict rests on on-ball numbers, we will say so. If a player's case depends on what he does without the ball, we will tell you that our numbers can't fully see it.
Second, we will keep separating the team fingerprint from the individual credit. Middlesbrough's box presence is a team fact. It is not evidence that any one Boro forward is good.
Third, we will keep watching the games. Bellingham's Clásico showed up in a box score as no goal and no assist. Most of what made it a good night would not appear there at all.
Somewhere in that match, runs and positions helped win a Clásico. Nobody counted it. We'd like to.
FAQ
What is off-ball work?
Everything a player does while a team-mate or an opponent has the ball: runs to create space, pressing, covering, holding a defensive line. It is most of a match for most players.
Why can't most football data measure it?
Because most football data logs events that happen to the ball. A run, a press that forces a long ball, or good positioning that stops a pass being attempted often creates no event at all.
Does the Beaumont Index measure off-ball work?
Only indirectly. Team numbers such as box presence, chance quality and pressing intensity reflect it, and we adjust defensive counts for possession. But we can't yet credit an individual run to the player who made it.
What would it take to measure it properly?
Data on where every player is throughout a match, not just the ball, and a model that compares what happened with what would probably have happened without the run.